Isabella's Bakery
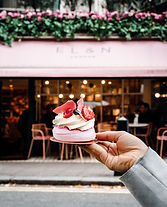
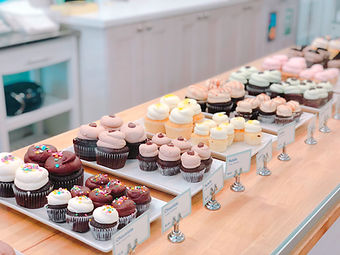
Isabella's Bakery is a family owned and operated bakery cafe . Isabella's offers a wide variety of food items from Korean baked goods, to other light fare, coffee & espresso, and specialty desserts. Through the process of researching, designing a mobile app and responsive website , and branding. I created a responsive website that would meet the goals of Isabella's Bakery and their customers.
Role : UX UI designer, Researcher
Duration: 8 Weeks
Responsibilities: Research; UI design; Multi device exploration ; UI kit; User testing; Prototyping; Wireframes.
Challenge: Isabella's Bakery is a small, family owned and operated Bakery. They currently solely rely on social
platforms such as Yelp, Facebook, and Instagram, however, they have the potential to build their online presence
and grow their business with a new website.
Design process :
Research
Empathize
Ideate
Prototype
Test
Implement
Research
Through market research, competitive analysis, and user interviews, I set out gain a deeper understanding of the market and Isabella’s customers.
Research Goals
In preparation to dive into my research, I first set some clear goals and created a research plan that would guide my research process.
-
Understand the market trends of the Bakery/Cafe industry
-
Identify Isabella’s target market
-
Identify Isabella’s competitors and evaluate strengths and weaknesses
-
Understand how people discover new, local businesses
-
Understand the experiences people have online and offline
-
Discover pain points that people encounter online and offline
Market Research
I started with market research to understand the general market, consumer, and business trends in order to gain a fuller understanding of Isabella’s market.
Market Trends:
-
According to the American Bakers Association, bakery products make up 2.1 percent of the gross domestic product of the United States
-
Profits are not particularly high because of the rising costs of wheat and sugar
-
Revenue for the Bakery Cafe industry has been adjusted to decline an estimated 1.3% in 2020 due to falling demand for food away from home as disposable income levels fall
-
The baking industry generates more than $30 billion in revenue each year
-
The industry includes 6,000 retail bakeries and nearly 3,000 commercial bakeries
-
Retail bakeries generate around $3 billion in revenues, and commercial bakeries sell $31 billion in products
-
Specialty beverages within this industry are growing faster than any other category. On their own, beverages accounting for $10.5 billion in 2016, which was about 18% of the total industry space (Specialty Food Industry)
Consumer Trends :
-
54% of bakery-cafe consumers visit these locations more so for their food or a specific food product, while 25% visit more so for their beverages or a particular beverage
-
Thirty-four percent of consumers—and 40% of millennials—prefer visiting restaurants offering dishes with new or innovative flavors/ingredients
-
Consumers are willing to pay more for an original, high-quality product
-
46 percent of respondents said that seasonal menu items would encourage them to visit bakery cafés more often (Statista)
-
25% of consumers visit bakery cafes at least once a week and 35% visit coffee cafes at least once a week
-
According to Innova Market Insights, for the United States, just 1.9% of survey respondents in 2018 said they purchased baked foods online. That’s compared with 80% who said they still purchase these goods at mass retailers.
Local Business Discovery :
-
Studies show that between 70-80% of people research a company online BEFORE visiting the small business or making a purchase with them
-
97% of consumers go online to find a local business or local services
-
84% of people trust online reviews as much as a personal recommendation
-
Mobile searches with the words “open near me now” have also increased by nearly 200%
-
61% of mobile searchers are more likely to contact a local business if they have a mobile-friendly site
-
46% of all searches on Google have local intent
-
75% of people have judged a company’s credibility based on its website design
-
Almost a third of online consumers in the United States used the internet to search for local businesses on a daily basis. According to the November 2019 survey, an additional 16 percent did so multiple times per week.
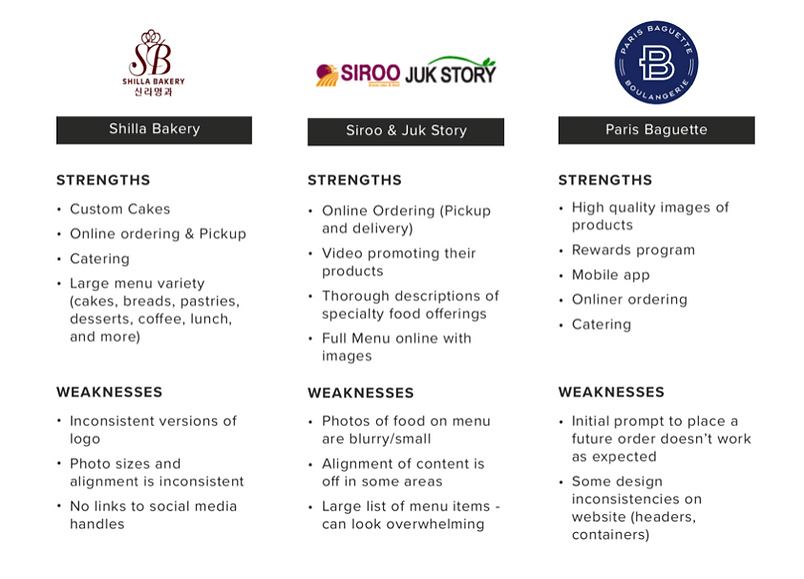
Competitive Analysis
Following my market research, I started to research Isabella's Bakery’s competitors so I could evaluate their strengths and weaknesses. The insights gained here provided key information in terms of the strengths we want to build upon and the weaknesses we want to avoid while keeping Isabella’s specific goals in mind.
User Interviews
Now, it was time to validate these provisional personas through user interviews with Isabella’s customers. During these interviews, I asked open-ended questions to learn as much as I could about their experiences and identify what the user’s needs truly are.
I conducted interviews with 5 people, about 15-20 minutes each.
Some questions asked during the interview:
-
How often do you visit bakery cafes?
-
Tell me about how you typically discover new local food businesses.
-
What motivates you to try a new local food business?
-
Why do you visit bakery cafes?
-
What factors influence your decision on which bakery cafe to visit?
-
Tell me about your most recent experience at a bakery cafe.
After conducting these one-on-one sessions with the participants, I wanted to take all this new information gained and synthesize it to better understand who the users are.
Empathy Map
Using an empathy map, I synthesized all the information I gathered during the user interviews to uncover key insights that led to identifying Isabella’s target user group.
First, I started by categorizing my notes into the categories of Doing, Thinking-Feeling, Seeing, Hearing, Gains, and Pains to get an overall understanding of everything learned during my interviews with the different participants.

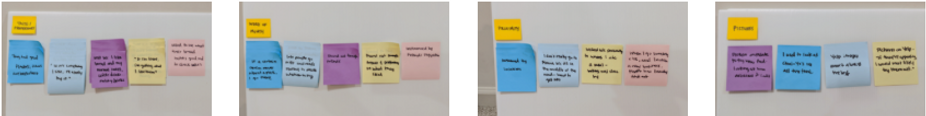
Tastes & Preferences
Many people discussed being influenced by being able to find something they like
Word of Mouth
Many people mentioned trying new things based on what other people say
Proximity
People expressed their preference to going to cafes that were close to their current location
Pictures
People shared that images were one of the decisive factors when trying something new
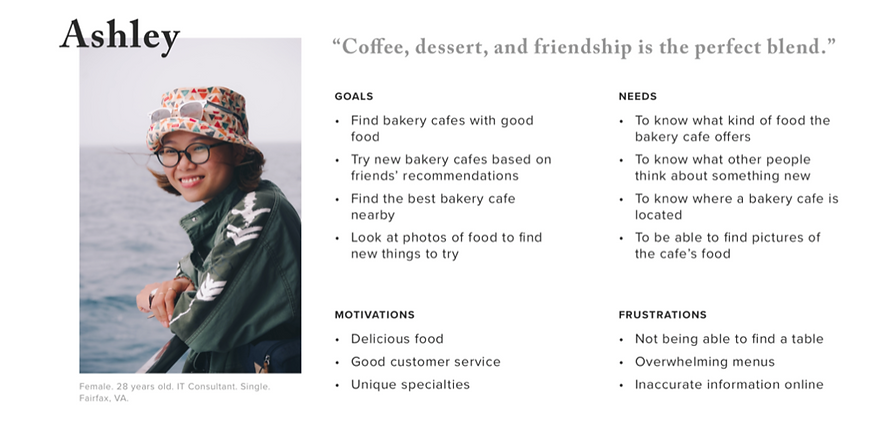
User Persona
Through my secondary and primary research, I was able to get a clear picture of who Manoa’s target users are and created a persona that would accurately represent them - meet Ashley! This persona continued to guide my decisions moving forward, making sure my design is centered on who our user Ashley is.
Defining the Problems
Now that we identified our target user, Ashley, it was time to identify what actual problems we are solving for based on what we have learned about our user.
To help define these problems, I used the insights gained from research and my understanding of Ashley’s needs to create POV Statements to frame the problem from the user’s perspective. I used these POV Statements to identify "How Might We" questions which would fuel my process to brainstorm solutions.

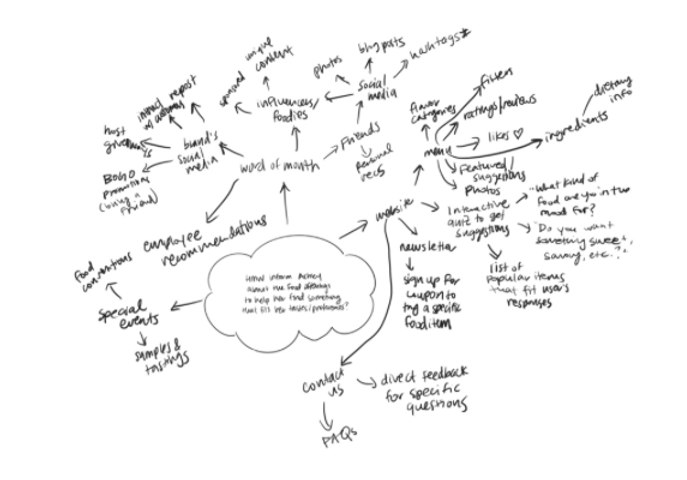
Brainstorming
Now that I knew what problems we needed to solve for Ashley, I started my brainstorming process to come up with solutions to those problems. I used the HMW questions that I identified and used those to help me brainstorm different ideas through mind mapping.
Strategizing
From brainstorming, I ended up with a lot of different ideas - now I wanted to strategize and determine which solutions we should prioritize to most effectively help Ashley meet her goals.
Project Goals
Before I could make any decisions on what kind of solutions we wanted to implement, I needed to have a clear understanding of the goals we are trying to meet. These goals would help guide the decisions made moving forward to ensure we are moving towards the right direction.

User Flow
In order to empathize with Ashley further, I created user flows in order to better understand her overall journey interacting with the website - taking a step into her thoughts and the different decisions she would make while trying to complete tasks in different scenarios.

Lo-Fi Wireframe Sketches
Taking what I’ve learned throughout my process to this point, I started to make decisions on how the content on Manoa’s website would be organized based on the project goals we want to meet.

Usability Testing
With my prototype completed, I started working on a test plan to guide the testing that would be conducted. I then recruited participants and conducted usability testing in order to see how users interact with my design and identify where improvements to the design can be made.
Test Objectives
-
Test if users can easily complete the tasks
-
Observe the different paths users take to complete tasks
-
Assess areas of improvement to improve the usability of the design
Tasks
We asked the participants to complete tasks such as:
-
Learn more about Isabella’s Bakery background.
-
Find out where Isabella’s Bakery is located.
-
See what kind of desserts Isabella’s offers.
Summary
We conducted testing with 5 participants to made observations on how they interacted with the prototype and completed the tasks.
-
Method: Remote, moderated usability testing (Think Aloud)
-
Participants: 5
-
Age: 25-30 years
-
Average Time: 7 minutes
-
Task Completion Rate: 100%
-
Error-Free Rate: 99.4%
Affinity Map
To get a better understanding of all the observations from testing, I used an affinity map to synthesize my findings. This helped me to get a better look at the different experiences users had and allowed draw connections and uncover key insights. These insights would help me identify what improvements would need to be made on our design to make sure we are helping our users painlessly meet their goals
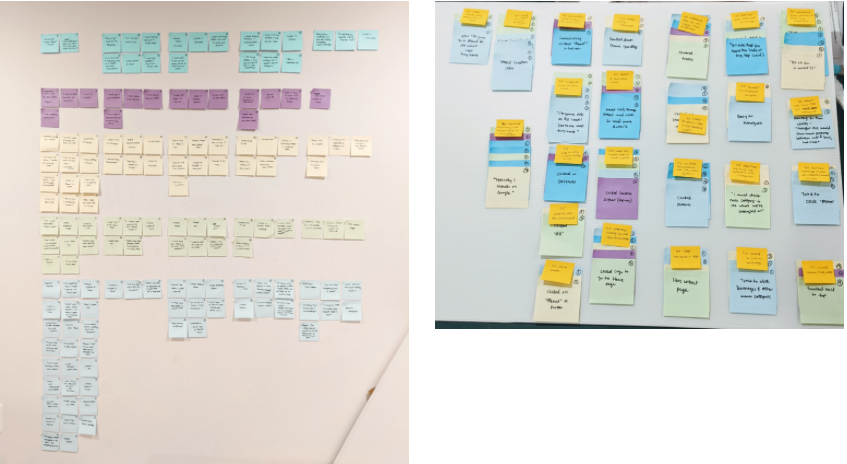
Amongst the patterns I uncovered, I was able to identify common pain points amongst our participants.
Pain Points
-
3/5 wanted to view more pictures on product details page
-
3/5 users scrolled back to the top after browsing to start looking for a specific item
-
2/5 had some confusion on what is clickable or hover-able in the navigation
-
2/5 weren’t clear on what the two circles under product details are
Based on these pain points, I was able to draw key insights which helped me to identify what improvements I should prioritize on the design.
Insights
-
People want to view multiple photos of the food
-
People want to know where they are when browsing the menu
-
Some people were initially confused on what links you should click on or hover over
-
Some people didn’t know what to expect from the circles under the product detail description
Recommendations
-
Add more photo options on product details page
-
Add breadcrumbs for browsing through the menu pages
-
Make sure all links are clickable and add an arrow icon next to nav links that have a dropdown
-
Add labels to each section to clearly describe what information will be displayed there
Lo-Fi Wireframe Sketches